1. All-in-One Financial Overview
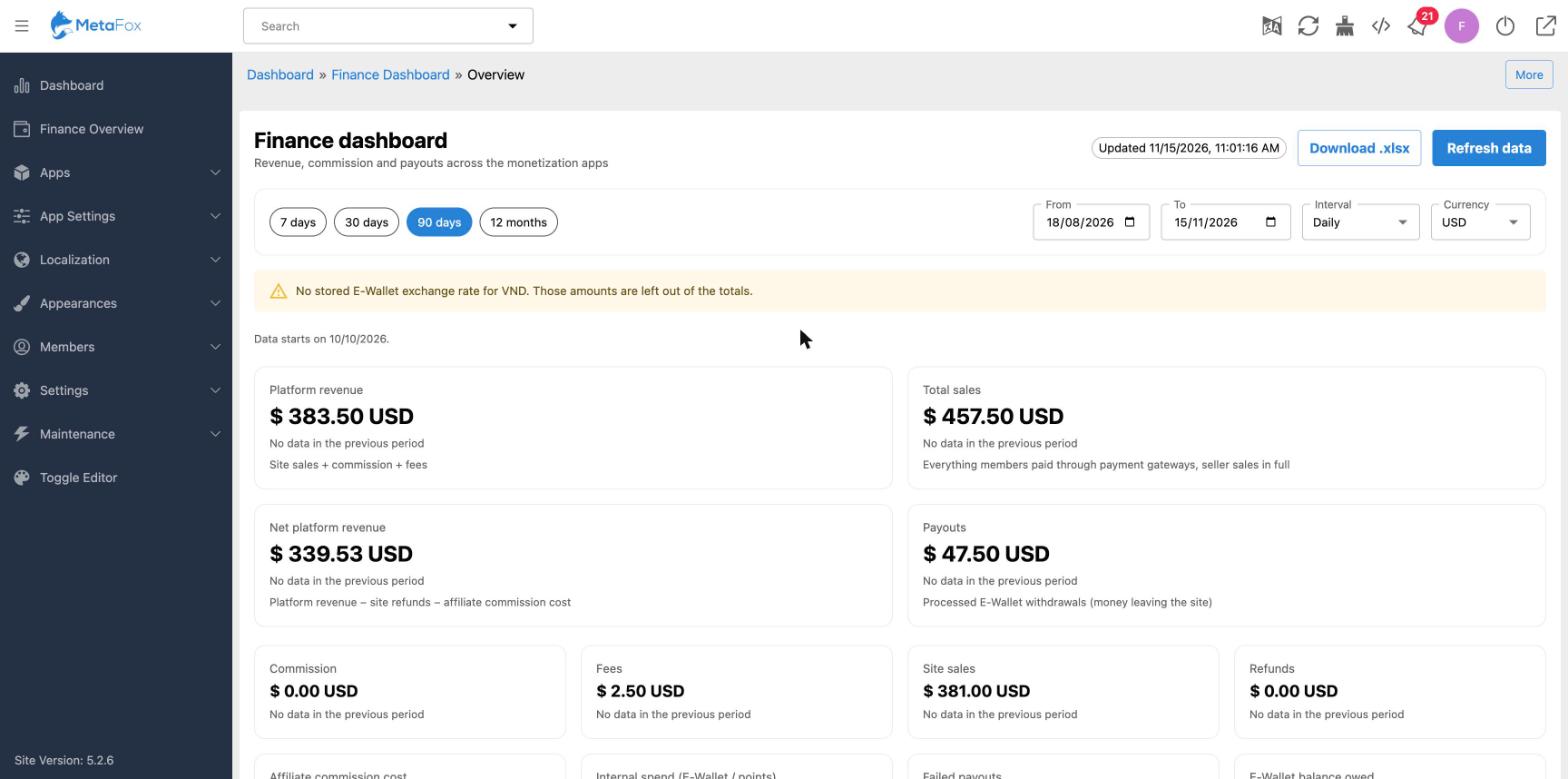
Get a complete picture of your platform's financial health in one place. Monitor 12 essential financial indicators, including platform revenue, total sales, net revenue, commissions, fees, refunds, payouts, affiliate costs, and E-Wallet balances.
2. Advanced Financial Analytics
Analyze financial performance with flexible date ranges, multiple reporting intervals, and currency filters. Compare current results with previous periods to better understand your platform's financial growth.
3. Interactive Financial Trends
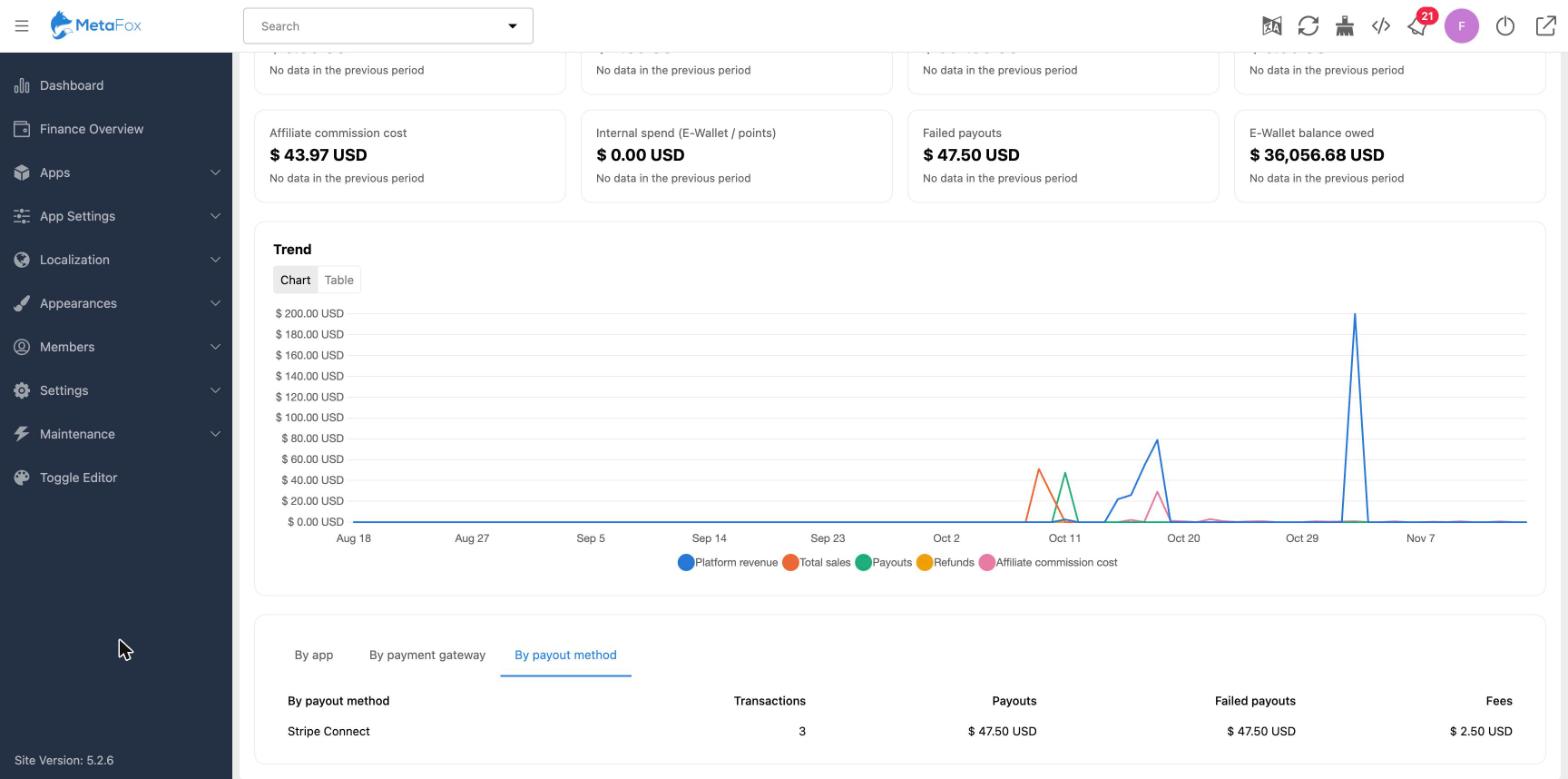
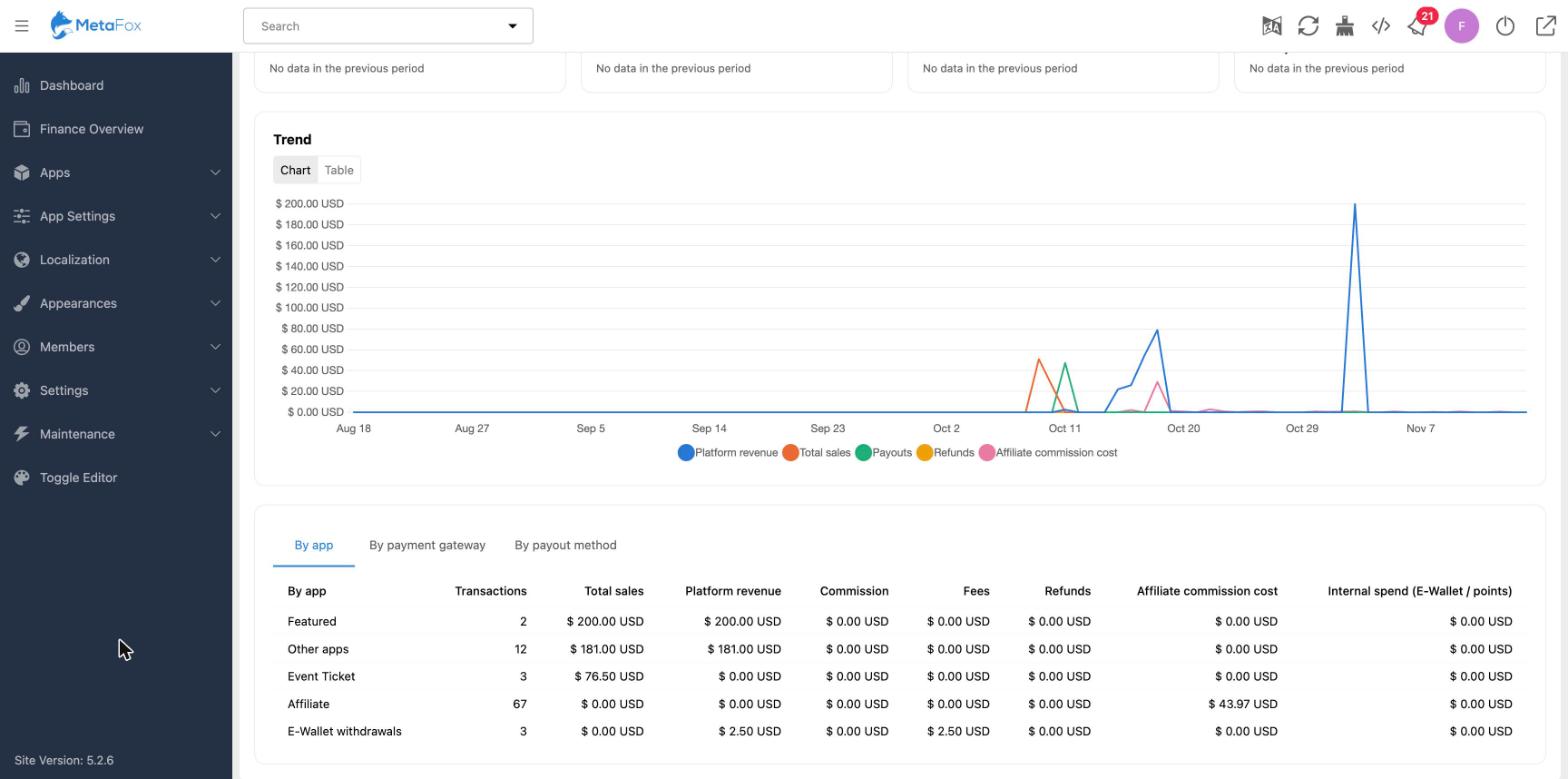
Visualize your financial activity through interactive charts or detailed tables. Track revenue, sales, payouts, refunds, and affiliate commission costs over time to identify important financial trends.
4. Detailed Monetization Breakdown
Understand where your platform's money comes from with dedicated breakdowns by monetization app, payment gateway, and payout method. See transaction counts and financial figures to evaluate each revenue source.
5. Professional Excel Reporting
Export comprehensive financial reports in Excel format. Reports include six worksheets covering financial summaries, daily trends, app performance, payment gateways, payout methods, and raw financial records.
6. Automated Data Processing
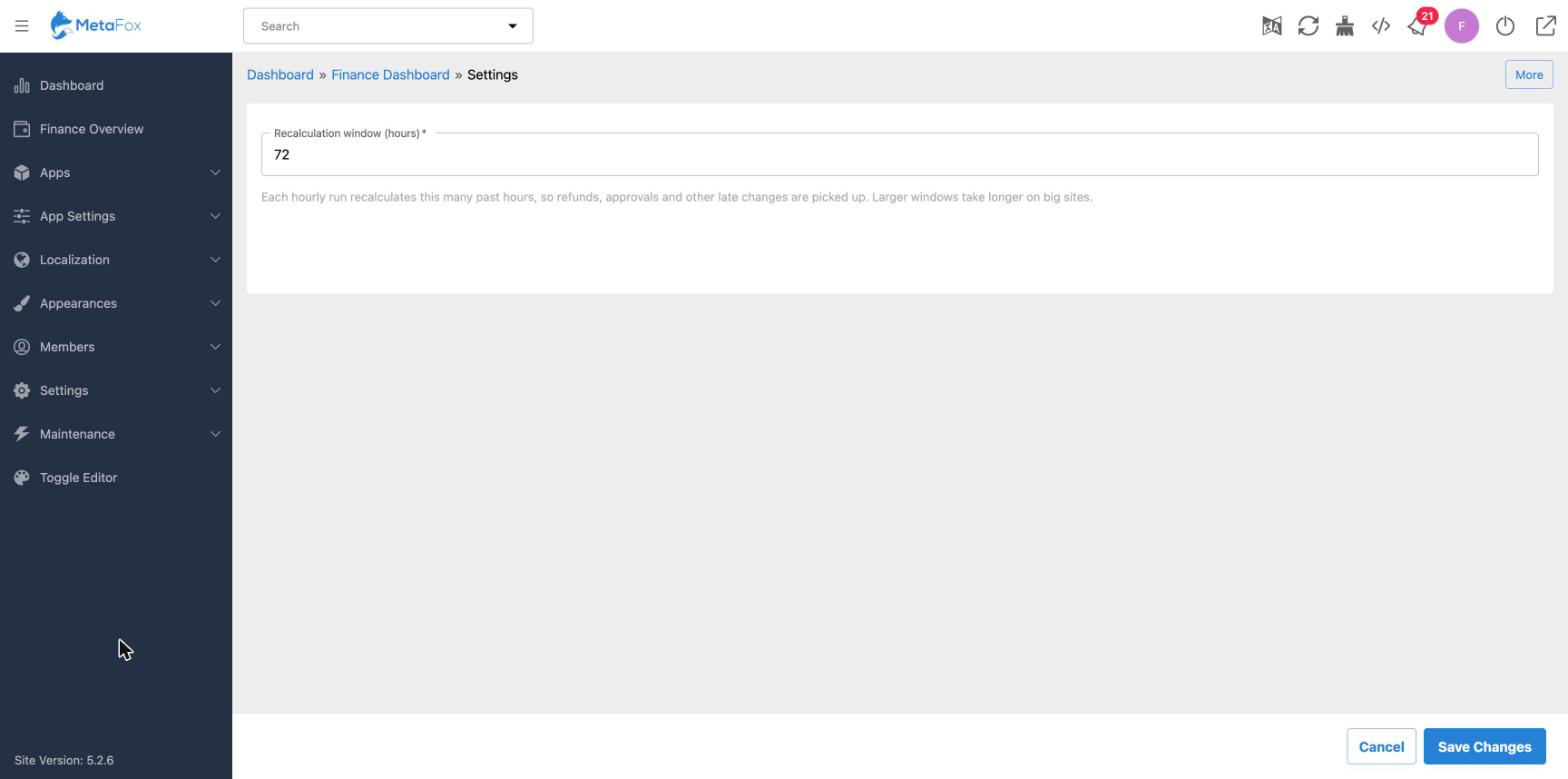
Financial statistics are collected automatically every hour. Administrators can also trigger manual data refreshes, while the system recalculates recent transactions to capture late refunds and approvals.
7. Flexible Data & Access Management
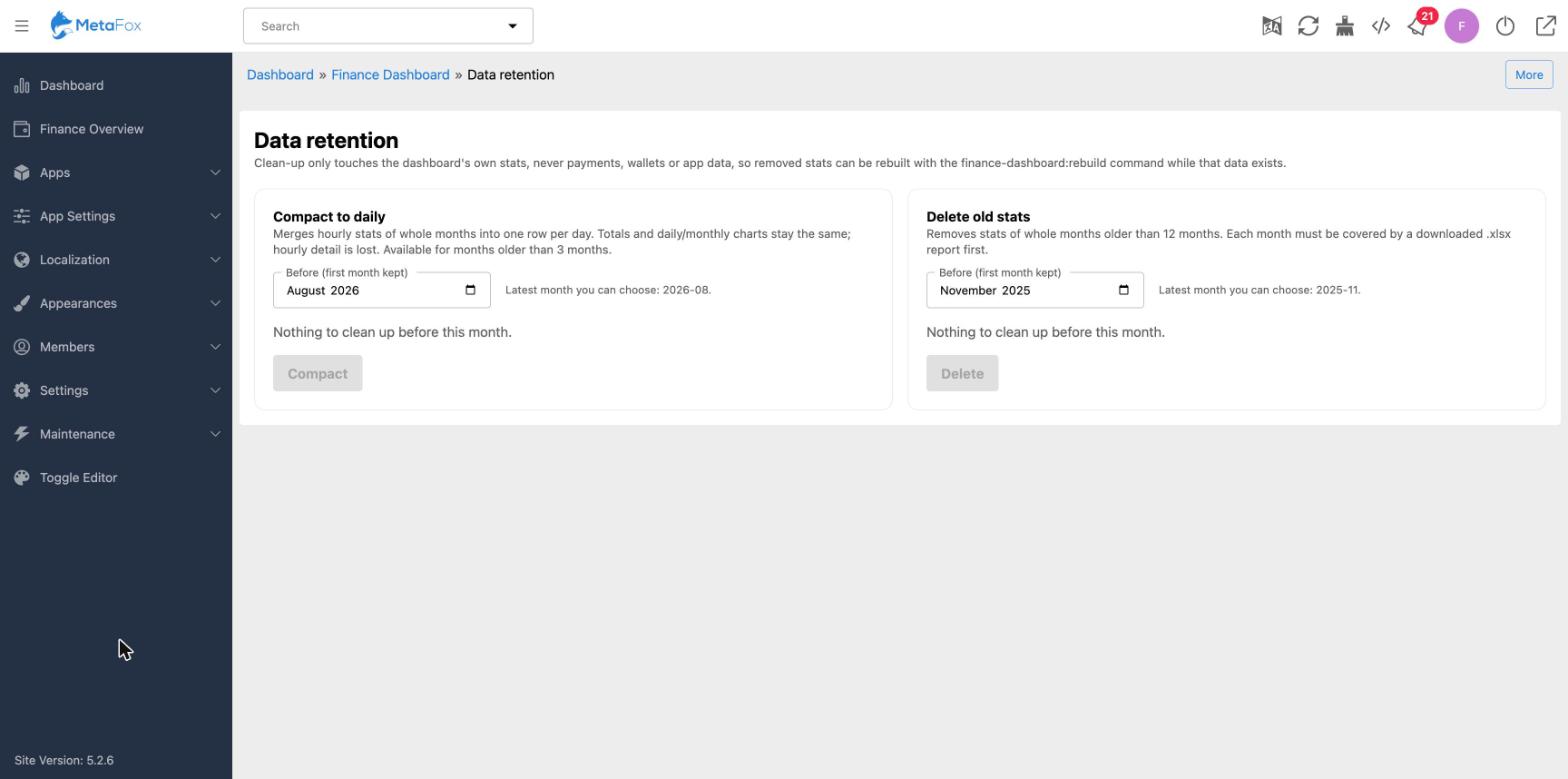
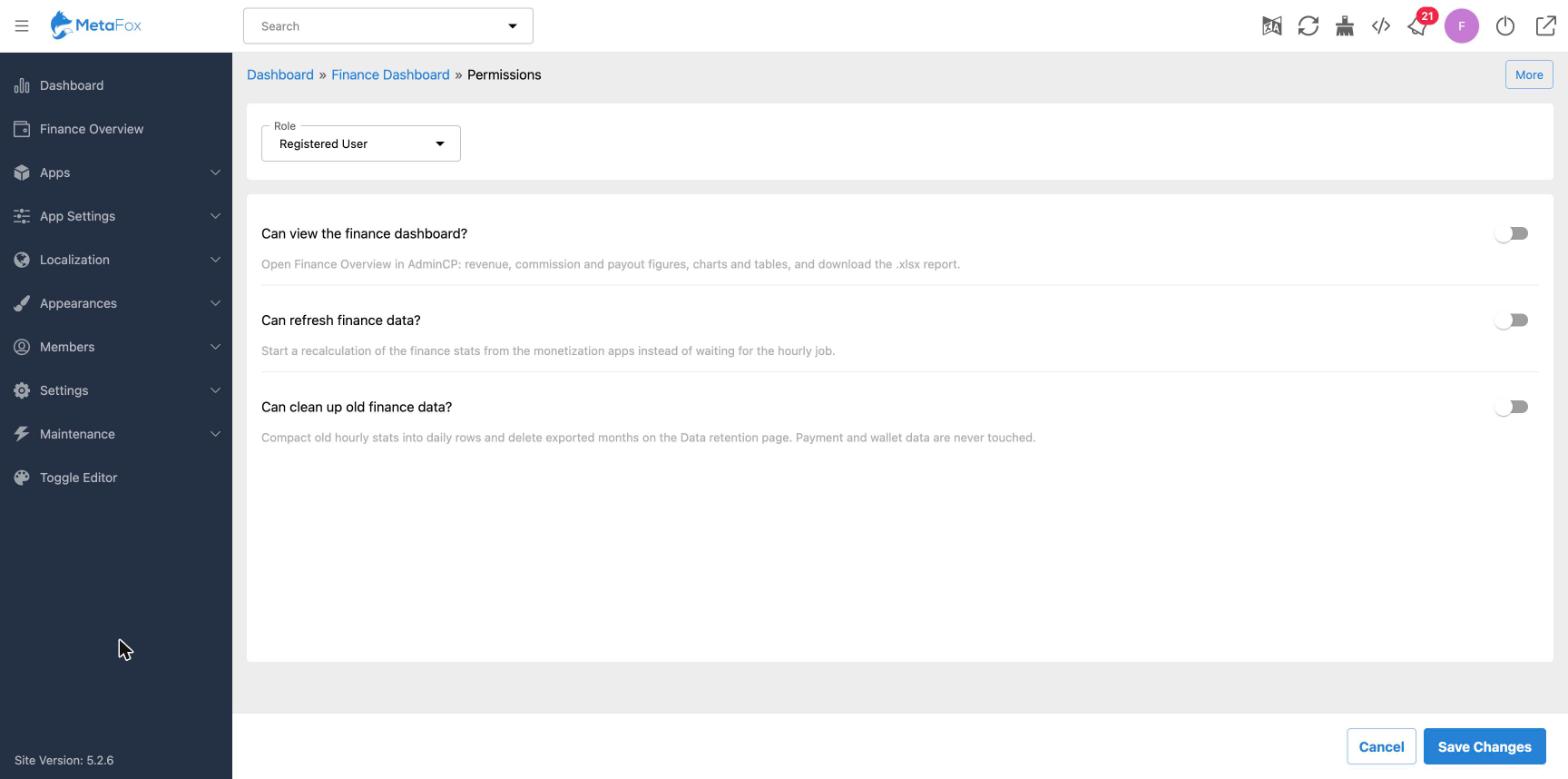
Manage historical statistics through data compaction and cleanup tools. Configure role-based permissions to control dashboard access, data refresh operations, and data retention management. Developers can also extend the dashboard with custom financial data collectors.